Gluu Metrics#
Overview#
The metrics plugin gathers statistics for authentication-related events generated by Gluu Gateway against its associated Gluu Server. Metrics are exposed in the Prometheus exposition format, which can be scraped by a Prometheus Server.
Configuration#
The plugin can be configured on Service, Route and Global levels. There are several possibilities for plugin configuration with services and routes. More details are available in the Kong docs.
We recommend enabling the plugin Globally so metrics are gathered for all Gluu Gateway services.
Using the UI#
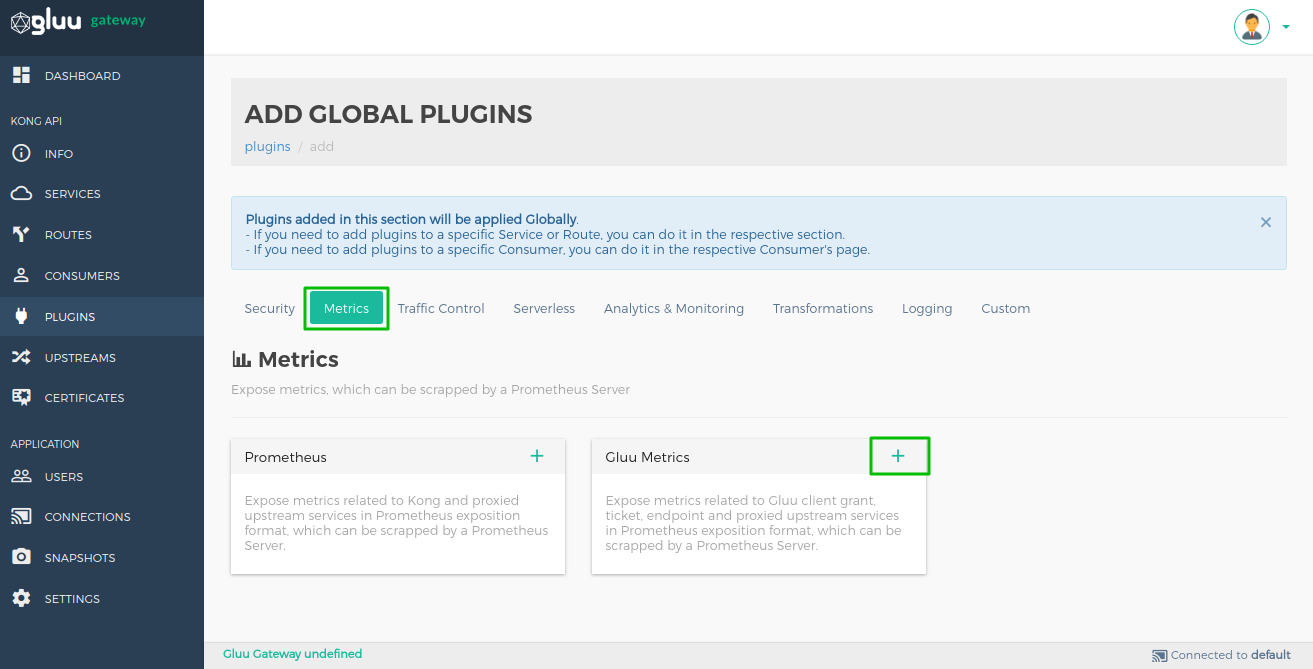
Navigate to the Add Global Plugin section in the UI to enable the Gluu Metrics plugin. In the Metrics category, there is a Gluu Metrics box. Click the + icon to enable the plugin.
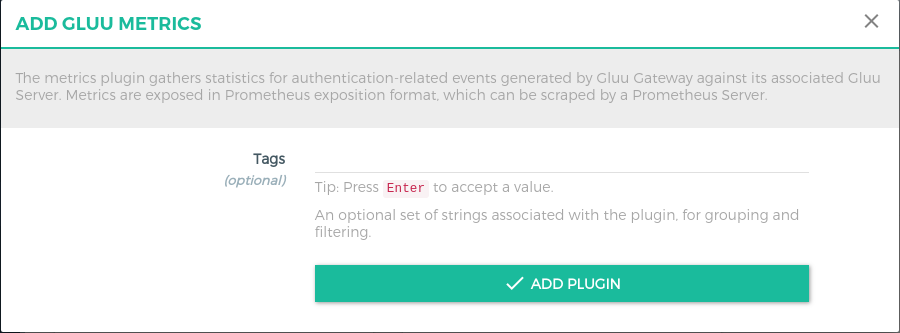
After clicking +, the following form will be presented where a Consumer ID can be added:
Using the API#
$ curl -X POST \
  http://<kong_hostname>:8001/plugins \
  -H 'Content-Type: application/json' \
  -d '{
  "name": "gluu-metrics"
}'
Metrics Endpoint#
Metrics are available via the following Admin API endpoint: http://<kong_hostname>:8001/gluu-metrics
Available metrics#
-
gluu_endpoint_method: Counts how many times an endpoint is called per method.
-
gluu_oauth_client_authenticated: Counts how many times a client (consumer) is authenticated by the OAUTH-PEP plugin per service.
-
gluu_oauth_client_granted: Counts how many times a client (consumer) is granted access (authorize by OAUTH Scope Expression) by the OAUTH-PEP plugin per service.
-
gluu_uma_client_authenticated: Counts how many times a client (consumer) is authenticated by the UMA-PEP plugin per service.
-
gluu_uma_client_granted: Counts how many times a client (consumer) is granted access (authorized by UMA Scope and Policies) by the UMA-PEP plugin per service.
-
gluu_uma_ticket: Counts how many times an UMA Permission Ticket has been issued by the user for access to resources. This will only count tickets for UMA-PEP.
-
gluu_openid_connect_users_authenticated: Counts how many time user authenticated by the OpenID Connect
-
gluu_opa_client_granted: Counts how many time user authorized by the OPA PEP plugin.
-
gluu_total_client_authenticated: Counts the total authentication done by all authentication plugin that is
gluu-oauth-auth,gluu-uma-authandgluu-openid-connect. -
gluu_total_client_granted: Counts the total authorization done by all authorization plugin that is
gluu-oauth-pep,gluu-uma-pepandgluu-opa-pep.
Example metrics#
The following is an example of metrics available via the endpoint /gluu-metrics:
# HELP gluu_endpoint_method Endpoint call per service in Kong
# TYPE gluu_endpoint_method counter
gluu_endpoint_method{endpoint="/comments",method="POST",service="JSON-API"} 40
gluu_endpoint_method{endpoint="/comments/1",method="DELETE",service="JSON-API"} 40
gluu_endpoint_method{endpoint="/comments/1",method="GET",service="JSON-API"} 40
gluu_endpoint_method{endpoint="/posts/1",method="DELETE",service="JSON-API"} 40
gluu_endpoint_method{endpoint="/posts/1",method="GET",service="JSON-API"} 40
gluu_endpoint_method{endpoint="/posts/1",method="GET",service="none-claim-gatering"} 2

# HELP gluu_nginx_metric_errors_total Number of nginx-lua-prometheus errors
# TYPE gluu_nginx_metric_errors_total counter
gluu_nginx_metric_errors_total 0

# HELP gluu_oauth_client_authenticated Client(Consumer) OAuth authenticated per service in Kong
# TYPE gluu_oauth_client_authenticated counter
gluu_oauth_client_authenticated{consumer="@!19CF.B296.532F.83E2!0001!25C1.E1E4!0008!B9EF.436E.5D35.0C58",service="JSON-API"} 200

# HELP gluu_oauth_client_granted Client(Consumer) OAuth granted per service in Kong
# TYPE gluu_oauth_client_granted counter
gluu_oauth_client_granted{consumer="@!19CF.B296.532F.83E2!0001!25C1.E1E4!0008!B9EF.436E.5D35.0C58",service="JSON-API"} 200

# HELP gluu_uma_client_authenticated Client(Consumer) UMA authenticated per service in Kong
# TYPE gluu_uma_client_authenticated counter
gluu_uma_client_authenticated{consumer="@!19CF.B296.532F.83E2!0001!25C1.E1E4!0008!B9EF.436E.5D35.0C58",service="none-claim-gatering"} 1

# HELP gluu_uma_client_granted Client(Consumer) UMA granted per service in Kong
# TYPE gluu_uma_client_granted counter
gluu_uma_client_granted{consumer="@!19CF.B296.532F.83E2!0001!25C1.E1E4!0008!B9EF.436E.5D35.0C58",service="none-claim-gatering"} 1

# HELP gluu_uma_ticket Permission Ticket getting per services in Kong
# TYPE gluu_uma_ticket counter
gluu_uma_ticket{service="none-claim-gatering"} 1

# HELP gluu_openid_connect_users_authenticated User authenticated per service in Kong
# TYPE gluu_openid_connect_users_authenticated counter
gluu_openid_connect_users_authenticated{service="jsonplaceholder"} 5

# HELP gluu_total_client_authenticated Total authentication(OAuth, UMA and OpenID Connect) in Kong
# TYPE gluu_total_client_authenticated counter
gluu_total_client_authenticated 6

# HELP gluu_total_client_granted Total authorization(OAuth, UMA and OPA PEP) in Kong
# TYPE gluu_total_client_granted counter
gluu_total_client_granted 3
Prometheus Server Configuration#
Configure a Prometheus server to listen to the metrics endpoint gluu-metrics
- Install prometheus server v2.6.0
- Add the
/gluu-metricsendpoint in prometheus.yml, in the scrape_configs section:
- job_name: gluu metrics_path: /gluu-metrics static_configs: - targets: [http://<kong_hostname>:8001] - Restart the Prometheus server.
Grafana Configuration#
Metrics exported by the plugin can be graphed in Grafana using a drop-in dashboard: Gluu-Metrics-Grafana.json.
- Install Grafana v5.4.2
- Add Datasource
- Start the grafana service
- Open in browser (Default port 3000. http://
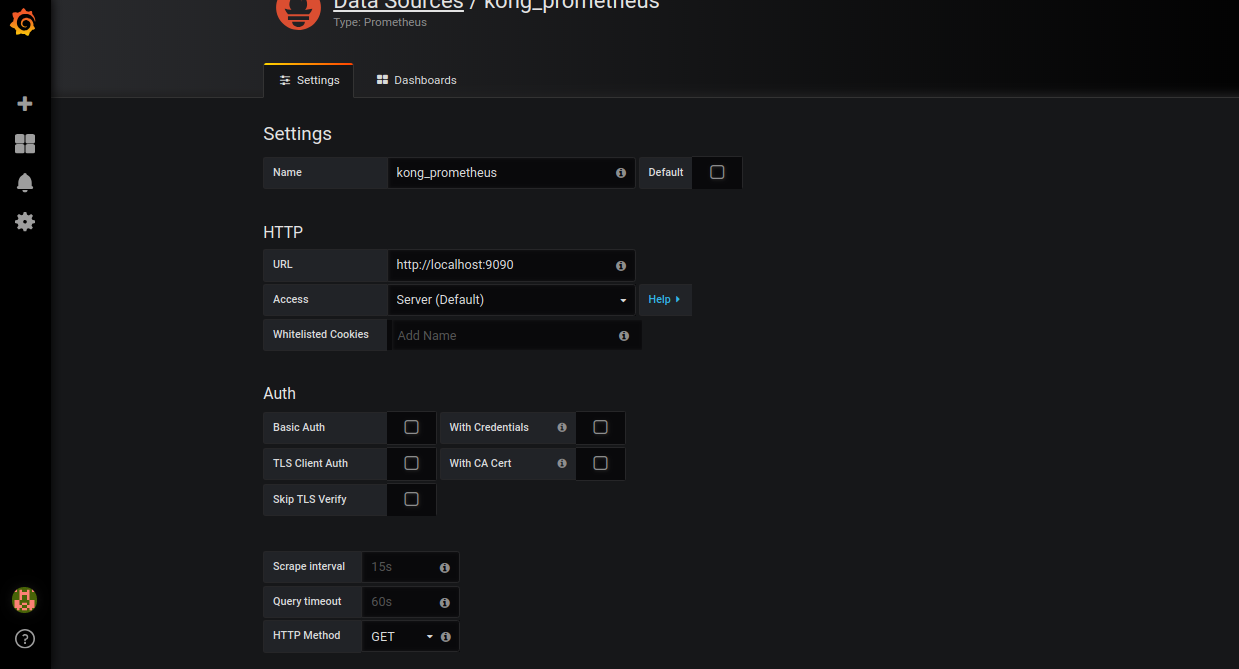
:3000) - Configuration > Data sources > Add data source > Prometheus
- Add the Prometheus server URL
- Import JSON: Gluu-Metrics-Grafana.json
- Go to the home page
- Click on
New dashboardon top left corner. - Click on
import dashboard - Upload .json file