Gluu Server Logs#
Overview#
When it comes to troubleshooting issues in the Gluu Server-from service hiccups to outages-logs are the best place to start.
The Gluu Server administrator can investigate logs from the oxTrust View Logs feature or directly with SSH access to the Gluu-Server container.
View Log File#
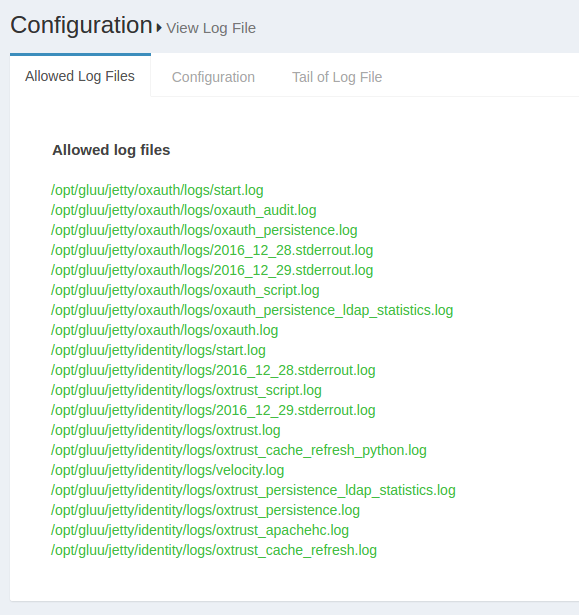
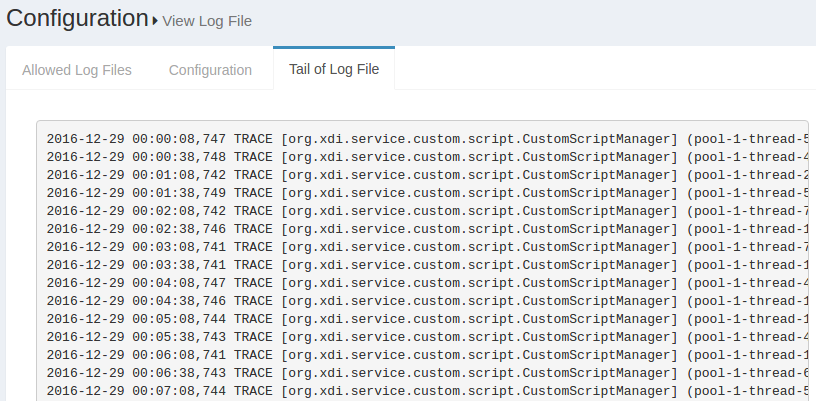
Previously configured log files can be viewed using the View log file feature. This feature can be accessed through the configuration menu using Configuration --> View Log File.

The Display last lines count field contains the lines that will be displayed in the Web GUI. If the field contains the value 400, then the Gluu Server will show the last 400 lines of the log in the GUI. The screenshot below shows an according example.

Note
Logs can be set up for Apache Kafka log aggregation using this tutorial
Log Levels#
Logging Levels configuration through OxTrust UI
The following log levels are available in oxTrust:
| Log Level | Messages Logged |
|---|---|
| Trace | All messages |
| Debug | Debug level and above |
| Info | Informational level and above |
| Warn | Warning level and above |
| Error | Error level and above |
| Fatal | Only fatal errors |
| off | Logging is disabled |
These logging levels can also be set in oxTrust UI.
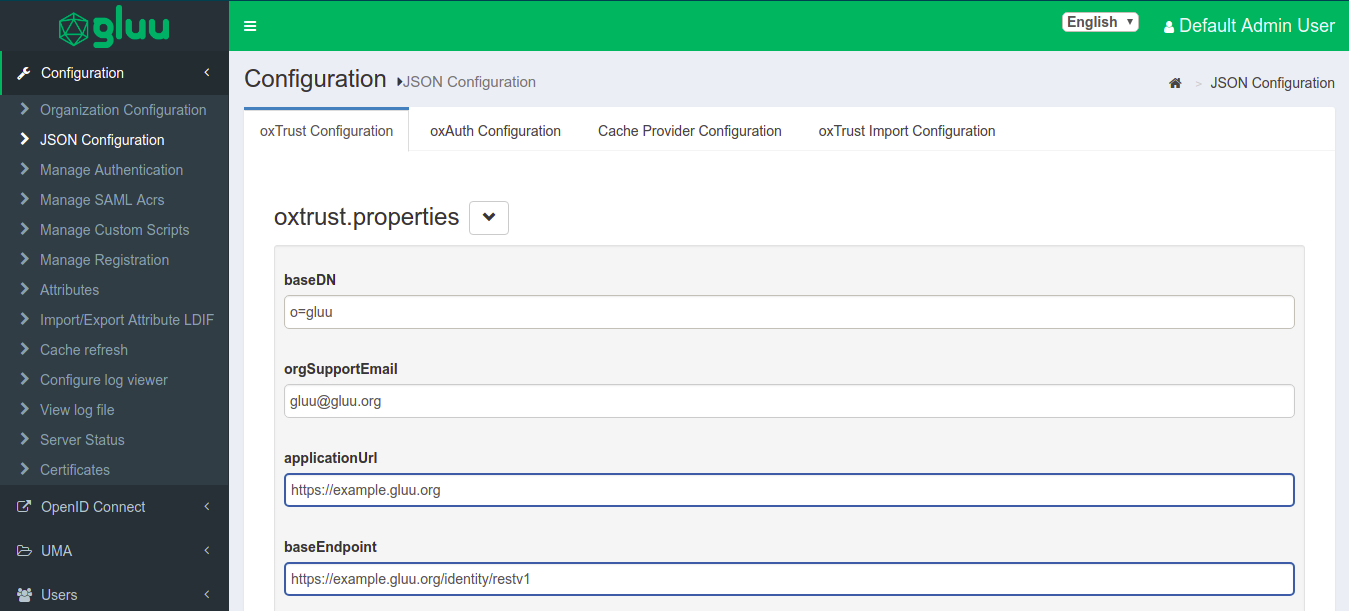
- Login to oxTrust UI as
adminor with an administrator account. - Navigate to Configuration > JSON Configuration > OxTrust Configuration Tab.

- Scroll to the very bottom of the page.
- Click on the
logging leveland select the levels from the drop down. - Default value will be set to
Default, you can change the level as per your requirement for extensive troubleshooting. - Click on
Save Configurationto save the configuration.
Changing Log Levels using log4j2.xml
Note
It is recommended to use oxTrust UI to change the logging levels.
Gluu Server logs use the log4j2 logging levels, which can be changed in a copy of the log4j2.xml configuration file designated in the JSON configuration.
The original log4j2.xml can be found in the following path:
/opt/jetty-9.4/temp/jetty-localhost-8082-identity.war-_identity-any-8516765662711672787.dir
Move a copy of log4j2.xml to any location outside the temp directory, then specify the new filepath in the externalLoggerConfiguration oxAuth JSON setting.
The same file can be found in all incorporated Gluu apps, i.e oxAuth, IDP, oxAuth-RP and Identity.
The available logging levels are:
| Log Level | Messages Logged |
|---|---|
| Trace | All messages |
| Debug | Debug level and above |
| Info | Informational level and above |
| Warn | Warning level and above |
| Error | Error level and above |
| Fatal | Only fatal errors |
| off | Logging is disabled |
The following files define the log levels in Gluu Server. Please edit the file with the levels given above and restart the jetty server. The following section is taken from a live Gluu Server log4j.xml file showing different log levels for different logs. The changes made this section will reflect in the logs.
<category name="org.gluu.oxauth">
        <priority value="TRACE" />
    </category>

    <!- ############### Gluu ################# ->
    <category name="org.gluu">
        <priority value="TRACE" />
    </category>

    <!- ############### openxdi ################# ->
    <category name="org.openxdi">
        <priority value="TRACE" />
    </category>

    <!- ############### oxTrust ################# ->
    <category name="org.gluu.oxtrust">
        <priority value="TRACE" />
    </category>

    <!- ############### Embedded JBoss AS ################# ->
    <category name="org.jboss">
        <priority value="ERROR" />
    </category>
    <category name="com.arjuna">
        <priority value="ERROR" />
    </category>
Restart any changed services to allow the changes to take effect.
Setup Logs#
The setup logs are stored inside the /install/community-edition-setup/ folder. There are two logs available, one detailing the setup process and the other documenting the errors:
- setup.log
- setup_error.log
Core logs#
The available log files for Gluu Server Community Edition inside the chroot environment are listed below.
| Log File | Component |
|---|---|
| /install/community-edition-setup/setup.log | Setup detail log |
| /install/community-edition-setup/setup_error.log | Setup error log |
| /opt/gluu/jetty/idp/logs/start.log | Logs time-stamp when IDP starts |
| /opt/shibboleth-idp/logs/idp-warn.log /opt/shibboleth-idp/logs/idp-process.log |
IDP diagonostic log Read more.. |
| /opt/shibboleth-idp/logs/idp-audit.log | General audit log Read more.. |
| /opt/shibboleth-idp/logs/idp-consent-audit.log | Consent audit log Read more.. |
| /opt/gluu/node/passport/node_modules/redis-parser/isolate-0x3615b50-v8.log /opt/gluu/node/passport/node_modules/redis-parser/isolate-0x28e7b50-v8.log |
Passport log |
| /opt/gluu/jetty/oxauth/logs/start.log | Logs time-stamp when oxAuth starts |
| /opt/gluu/jetty/oxauth/logs/oxauth_audit.log | General audit log |
| /opt/gluu/jetty/oxauth/logs/oxauth_persistence.log | Logs connection with LDAP |
| /opt/gluu/jetty/oxauth/logs/oxauth_script.log | Logs for oxAuth custom script execution |
| /opt/gluu/jetty/oxauth/logs/oxauth.log | General log for oxAuth service |
| /opt/gluu/jetty/oxauth-rp/logs/start.log | Logs time-stamp when oxAuthRP starts |
| /opt/gluu/jetty/oxauth-rp/logs/oxauth-rp.log | General oxAuthRP log |
| /opt/gluu/jetty/identity/logs/start.log | Logs time-stamp when oxTrust starts |
| /opt/gluu/jetty/identity/logs/oxtrust_script.log | |
| /opt/gluu/jetty/identity/logs/oxtrust.log | Logs for oxTrust custom script execution |
| /opt/gluu/jetty/identity/logs/oxtrust_persistence.log | Logs connection with LDAP |
| /opt/gluu/jetty/identity/logs/oxtrust_cache_refresh.log | Logs events relating to cache refresh |
| /opt/gluu/jetty/identity/logs/oxtrust_velocity.log | Log events related to the Apache Velocity template engine |
| /opt/gluu/jetty/identity/logs/oxtrust_cleaner.log | Logs information about the oxTrust clean-up services |
oxAuth logs#
The oxAuth logs contain the information about oxAuth authentication process and errors.
The key oxAuth logs are
-
oxauth.logunder/opt/gluu/jetty/oxauth/logs/
This log is gathering most of the authentication related information. Generally this is the first log to review for any authentication-related troubleshooting, like authentication failure or missing clients etc. Here's an example showing a successful user authentication:2016-07-16 15:43:28,232 INFO [org.gluu.oxauth.auth.Authenticator] Authentication success for Client: '@!EFCB.890F.FB6C.2603!0001!0A49.F454!0008!F047.7275' 2016-07-16 15:43:28,232 TRACE [org.gluu.oxauth.auth.Authenticator] Authentication successfully for '@!EFCB.890F.FB6C.2603!0001!0A49.F454!0008!F047.7275' 2016-07-16 15:43:28,238 DEBUG .gluu.oxauth.token.ws.rs.TokenRestWebServiceImpl] Attempting to request access token: grantType = authorization_code, code = 61ba3c0d-42c4-4f1f-8420-fd5f6707f1b1, redirectUri = https://test.gluu.org/identity/authentication/authcode, username = null, refreshToken = null, clientId = null, ExtraParams = {grant_type=[Ljava.lang.String;@1add2a62, redirect_uri=[Ljava.lang.String;@2e0995b5, code=[Ljava.lang.String;@7743b5af}, isSecure = true, codeVerifier = null 2016-07-16 15:43:28,249 DEBUG [org.gluu.oxauth.service.UserService] Getting user information from LDAP: userId = zico -
oxauth_script.logunder/opt/gluu/jetty/oxauth/logs/
Most of the custom script's initialization and few more information are loaded here in this script. In the sample log below we can see 'Super Gluu' 2FA has been loaded in the Gluu Server:2016-07-16 19:06:32,705 INFO [org.gluu.service.PythonService] (pool-2-thread-2) oxPush2. Initialization 2016-07-16 19:06:32,713 INFO [org.gluu.service.PythonService] (pool-2-thread-2) oxPush2. Initialize notification services 2016-07-16 19:06:32,750 INFO [org.gluu.service.PythonService] (pool-2-thread-2) oxPush2. Initialized successfully. oneStep: 'False', twoStep: 'True', pushNotifications: 'False' -
oxauth_persistence_duration.logunder/opt/gluu/jetty/oxauth/logs/
This log contains information on the total execution times for LDAP operations such asaddandsearch. It records at theDEBUGlevel, so it does not affect production environment performance.
oxTrust logs#
-
oxtrust.logunder/opt/gluu/jetty/identity/logs
This log gather logs related to Gluu Server Admin panel (called oxTrust). For example, what is the clientID of an oxTrust session? Or, what scopes are being used, etc. In the example below, you can see an admin user has successfully logged into thetest.gluu.orgGluu Server admin panel, has the proper authorizationCode, a redirectURI, and the user's role:2016-07-16 16:41:55,690 INFO [org.gluu.oxtrust.action.Authenticator] authorizationCode : 555a7586-6ca2-4b39-ab39-2ac78ec81524 2016-07-16 16:41:55,690 INFO [org.gluu.oxtrust.action.Authenticator] scopes : user_name email openid profile 2016-07-16 16:41:55,691 INFO [org.gluu.oxtrust.action.Authenticator] clientID : @!EFCB.890F.FB6C.2603!0001!0A49.F454!0008!F047.7275 2016-07-16 16:41:55,691 INFO [org.gluu.oxtrust.action.Authenticator] getting accessToken 2016-07-16 16:41:55,691 INFO [org.gluu.oxtrust.action.Authenticator] tokenURL : https://test.gluu.org/oxauth/seam/resource/restv1/oxauth/token 2016-07-16 16:41:55,691 INFO [org.gluu.oxtrust.action.Authenticator] Sending request to token endpoint 2016-07-16 16:41:55,692 INFO [org.gluu.oxtrust.action.Authenticator] redirectURI : https://test.gluu.org/identity/authentication/authcode 2016-07-16 16:41:55,919 DEBUG [org.gluu.oxtrust.action.Authenticator] tokenResponse : org.gluu.oxauth.client.TokenResponse@1914b8d -
oxtrust_script.logunder/opt/gluu/jetty/identity/logs
This log collects information on oxTrust related scripts and their operations. For example, if an organization uses a custom attribute which populates values for every user, then the Gluu Server Administrator needs to use a custom script for their 'Cache Refresh' process. This log will receive information when the custom script runs. -
oxtrust_cache_refresh.logunder/opt/gluu/jetty/identity/logs
Cache Refresh related information such as status, primary failure, etc., is available in this log. In the sample snippet below we see the total number of users that have been synced into the Gluu Server, number of failures, and total number of updated users.2016-07-16 17:18:17,691 DEBUG [gluu.oxtrust.ldap.cache.service.CacheRefreshTimer] (pool-1-thread-9) Updated person '@!EFCB.890F.FB6C.2603!0001!0A49.F454!0000!40EB.AB8E' 2016-07-16 17:18:17,691 INFO [gluu.oxtrust.ldap.cache.service.CacheRefreshTimer] (pool-1-thread-9) Updated '2,002' entries 2016-07-16 17:18:17,722 INFO [gluu.oxtrust.ldap.cache.service.CacheRefreshTimer] (pool-1-thread-9) Failed to update '0' entries 2016-07-16 17:18:17,738 DEBUG [gluu.oxtrust.ldap.cache.service.CacheRefreshTimer] (pool-1-thread-9) Keep external persons: 'true' 2016-07-16 17:18:17,739 DEBUG [gluu.oxtrust.ldap.cache.service.CacheRefreshTimer] (pool-1-thread-9) Count entries '0' for removal from target server 2016-07-16 17:18:17,739 INFO [gluu.oxtrust.ldap.cache.service.CacheRefreshTimer] (pool-1-thread-9) Removed '0' persons from target server 2016-07-16 17:18:17,739 INFO [gluu.oxtrust.ldap.cache.service.CacheRefreshTimer] (pool-1-thread-9) There are '2,002' entries before updating inum list 2016-07-16 17:18:17,740 INFO [gluu.oxtrust.ldap.cache.service.CacheRefreshTimer] (pool-1-thread-9) There are '2,002' entries after removal '0' entries -
oxtrust_audit.logunder/opt/gluu/jetty/identity/logs
This log provides basic auditing for oxTrust identity. It gathers information about who did what, when, and from where in the following format:
Date - Object changed - Who applied the change - from which IP
For example:
2018-09-26 09:07:55,938 INFO [qtp804611486-16]- OPENID CLIENT @!2D59.8992.A7F7.CD81!0001!6290.A960!0008!ACA6.3181.A647.456C **MyOwnClient** ADDED BY USER Default Admin User FROM IP ADDRESS 192.168.1.6
oxtrust_persistence_duration.logunder/opt/gluu/jetty/oxauth/logs/
This log contains information on the total execution times for LDAP operations such asaddandsearch. It records at theDEBUGlevel, so it does not affect production environment performance.
client_id and/or client_name logging#
oxTrust configured to generate and view client_id and/or client_name logs. To configure client_id and/or client_name
-
Log in to oxTrust UI
-
Navigate to
oxTrust>Configuration>oxAuth -
For client_id to be populated and viewed in the logs set
logClientIdOnClientAuthenticationtotrue -
For client_name to be populated and viewed in the logs set
logClientNameOnClientAuthenticationtotrue
System log location#
These logs contain global system messages.
- For Ubuntu:
/var/log/syslog - For RPM based systems:
/var/log/messages
Web Server log location#
- For Debian:
/var/log/apache2/ - For RPM based systems:
/var/log/httpd/
Adjust Shibboleth log level#
If troubleshooting SAML issues, it may be necessary to adjust the Shibboleth log level temporarily. To do so, follow these steps.
- Navigate to
/opt/shibboleth-idp/conf/ - Open
logback.xmlin an editor -
Find the following snippet:
<!-- Logging level shortcuts. --> <variable name="idp.loglevel.idp" value="INFO" /> <variable name="idp.loglevel.ldap" value="WARN" /> <variable name="idp.loglevel.messages" value="INFO" /> <variable name="idp.loglevel.encryption" value="INFO" /> <variable name="idp.loglevel.opensaml" value="INFO" /> <variable name="idp.loglevel.props" value="INFO" /> -
Replace
INFOwithDEBUGto get more logging info - Restart the
idpservice - Navigate to
/opt/shibboleth-idp/logs/ - After the issue is resolved, be sure to set the level back to
WARNforidp.loglevel.ldapandINFOfor the other logs in the production server.
Web Server logs#
Apache httpd / apache2 logs are available in /var/log/httpd or /var/log/apache2 for Ubuntu.
-
access_log: This log contains information about requests coming into the Gluu Server, success status or requests, execution time for any request etc. -
error_log: This log shows error messages if the web server encounter any issue while processing incoming requests. -
other_vhosts_access.log: This log is specific to the Gluu Server setup and those links which are being requested by a user from a web browser. An example below:test.gluu.org:443 192.168.201.184 - - [17/Jul/2016:18:25:21 +0000] "GET /index.html HTTP/1.1" 200 13239 "-" "Java/1.7.0_95" test.gluu.org:443 192.168.201.1 - - [17/Jul/2016:18:25:56 +0000] "GET / HTTP/1.1" 302 2185 "-" "Mozilla/5.0 (Windows NT 10.0; WOW64) AppleWebKit/537.36 (KHTML, like Gecko) Chrome/51.0.2704.106 Safari/537.36" test.gluu.org:443 192.168.201.1 - - [17/Jul/2016:18:25:56 +0000] "GET /identity/ HTTP/1.1" 200 583 "-" "Mozilla/5.0 (Windows NT 10.0; WOW64) AppleWebKit/537.36 (KHTML, like Gecko) Chrome/51.0.2704.106 Safari/537.36" test.gluu.org:443 192.168.201.1 - - [17/Jul/2016:18:25:56 +0000] "GET /identity/home.htm HTTP/1.1" 302 272 "https://test.gluu.org/identity/" "Mozilla/5.0 (Windows NT 10.0; WOW64) AppleWebKit/537.36 (KHTML, like Gecko) Chrome/51.0.2704.106 Safari/537.36" test.gluu.org:443 192.168.201.1 - - [17/Jul/2016:18:25:56 +0000] "GET /identity/login?cid=4 HTTP/1.1" 302 474 "https://test.gluu.org/identity/" "Mozilla/5.0 (Windows NT 10.0; WOW64) AppleWebKit/537.36 (KHTML, like Gecko) Chrome/51.0.2704.106 Safari/537.36" test.gluu.org:443 192.168.201.1 - - [17/Jul/2016:18:25:56 +0000] "GET /oxauth/authorize?scope=openid+profile+email+user_name&response_type=code+id_token&nonce=nonce&redirect_uri=https%3A%2F%2Ftest.gluu.org%2Fidentity%2Fauthentication%2Fauthcode&client_id=%40%21EFCB.890F.FB6C.2603%210001%210A49.F454%210008%21F047.7275 HTTP/1.1" 302 450 "https://test.gluu.org/identity/" "Mozilla/5.0 (Windows NT 10.0; WOW64) AppleWebKit/537.36 (KHTML, like Gecko) Chrome/51.0.2704.106 Safari/537.36" -
There are few other logs like
ssl_access_log,ssl_error_log, andssl_request_logwhich are collecting information on port 443 specifically.
Remember the initial GET request will hit the Apache server first, and then be proxied via the AJP port 8082 to . If you see traffic on the web server, but not on Jetty, this is a good place to check to see if something is wrong. For example, you might want to check if the firewall is blocking port 8082 if you see something like this:
[Thu Jul 14 23:49:19 2016] [error] ajp_read_header: ajp_ilink_receive failed
[Thu Jul 14 23:49:19 2016] [error] (70007)The timeout specified has expired: proxy: read response failed from (null) (localhost)
[Thu Jul 14 23:49:20 2016] [error] (70007)The timeout specified has expired: ajp_ilink_receive() can't receive header
[Thu Jul 14 23:49:20 2016] [error] ajp_read_header: ajp_ilink_receive failed
[Thu Jul 14 23:49:20 2016] [error] (70007)The timeout specified has expired: proxy: read response failed from (null) (localhost)
Clearing Logs#
The "clear-logs" feature can be used to clear all log files with the extension .log, including system logs. Clear-logs can be helpful during troubleshooting, as well as research and development. We discourage its use in production systems if the logs are not backed-up. More features are planned. Please consider this as work in progress.
service gluu-server clear-logs
Kubernetes log instructions#
In a Kubernetes environment where each pod can have one or more replicas, it is easier to check the log by collecting all containers' logs, storing them in a single place and possibly searching the logs later. There are tools available to assist in this task, both open source and paid. This guide will show an example of how to collect selected container's logs (oxAuth, oxTrust, OpenDJ, oxShibboleth, oxPassport, and optionally NGINX), using Filebeat, Elasticsearch, and Kibana.
Prerequisites#
- The Elasticsearch container requires the host's specific
vm.max_map_countkernel setting to be at least 262144. Refer to the official installation page of Elasticsearch here.
Logging Containers in Kubernetes#
-
Create
filebeat.ymlfor custom Filebeat configuration:filebeat.config: modules: path: ${path.config}/modules.d/*.yml reload.enabled: false output.elasticsearch: hosts: '${ELASTICSEARCH_HOSTS:elasticsearch:9200}' filebeat.autodiscover: providers: - type: kubernetes templates: - condition: regexp: kubernetes.container.image: "ox[auth|trust|shibboleth]" config: - type: docker containers.ids: - "${data.kubernetes.container.id}" encoding: utf-8 enabled: true document_type: docker multiline.pattern: '^[0-9]{4}-[0-9]{2}-[0-9]{2}' multiline.negate: true multiline.match: after - condition: contains: kubernetes.container.image: wrends config: - type: docker containers.ids: - "${data.kubernetes.container.id}" encoding: utf-8 enabled: true document_type: docker include_lines: ['^\['] - condition: contains: kubernetes.container.image: oxpassport config: - type: docker containers.ids: - "${data.kubernetes.container.id}" encoding: utf-8 enabled: true document_type: docker include_lines: '^[0-9]{4}-[0-9]{2}-[0-9]{2}' - condition: contains: kubernetes.container.image: nginx config: - type: docker containers.ids: - "${data.kubernetes.container.id}" encoding: utf-8 enabled: true document_type: docker exclude_files: ['\.gz$'] processors: # decode the log field (sub JSON document) if JSONencoded, then maps it's fields to elasticsearch fields - decode_json_fields: fields: ["log"] target: "" # overwrite existing target elasticsearch fields while decoding json fields overwrite_keys: true - add_kubernetes_metadata: ~ - add_cloud_metadata: ~ # Write Filebeat own logs only to file to avoid catching them with itself in docker log files logging.to_files: true logging.to_syslog: false logging.level: warningSave the content into Kubernetes' ConfigMaps using
kubectl create cm filebeat-config --from-file=filebeat.ymlfor later use. -
Create a Kubernetes manifest file,
filebeat-roles.yaml:kind: ClusterRoleBinding apiVersion: rbac.authorization.k8s.io/v1 metadata: name: filebeat namespace: default subjects: - kind: User name: system:serviceaccount:default:default # Name is case sensitive apiGroup: rbac.authorization.k8s.io roleRef: kind: ClusterRole name: filebeat-role apiGroup: rbac.authorization.k8s.io --- kind: ClusterRole apiVersion: rbac.authorization.k8s.io/v1 metadata: name: filebeat-role namespace: default rules: - apiGroups: [""] # "" indicates the core API group resources: - namespaces - pods verbs: - get - watch - listAfterwards, run
kubectl apply -f filebeat-roles.yamlto define custom roles and role binding for Filebeat. -
Create a Kubernetes manifest file,
elasticsearch.yaml:apiVersion: v1 kind: Service metadata: name: elasticsearch labels: app: elasticsearch spec: ports: - port: 9200 name: elastic targetPort: 9200 protocol: TCP - port: 9300 name: elastic-cluster targetPort: 9300 protocol: TCP selector: app: elasticsearch clusterIP: None --- apiVersion: apps/v1 kind: StatefulSet metadata: name: elasticsearch labels: app: elasticsearch spec: serviceName: elasticsearch replicas: 1 selector: matchLabels: app: elasticsearch template: metadata: labels: app: elasticsearch spec: containers: - name: elasticsearch imagePullPolicy: Always image: docker.elastic.co/elasticsearch/elasticsearch:6.6.1 ports: - containerPort: 9200 name: elastic - containerPort: 9300 name: elastic-cluster env: - name: cluster.name value: "gluu-cluster" - name: bootstrap.memory_lock value: "false" - name: ES_JAVA_OPTS value: "-Xms512m -Xmx512m" - name: TAKE_FILE_OWNERSHIP value: "true" volumeMounts: - name: elasticsearch-data mountPath: /usr/share/elasticsearch/data volumes: - name: elasticsearch-data hostPath: path: /data/elasticsearch/data type: DirectoryOrCreateRun
kubectl apply -f elasticsearch.ymlto deploy Elasticsearch Pod. -
Create a Kubernetes manifest file,
filebeat-ds.yaml:apiVersion: extensions/v1beta1 kind: DaemonSet metadata: name: filebeat labels: app: filebeat spec: template: metadata: labels: app: filebeat spec: terminationGracePeriodSeconds: 30 containers: - name: filebeat image: docker.elastic.co/beats/filebeat:6.6.1 args: [ "-e", "-strict.perms=false", ] env: - name: ELASTICSEARCH_HOST value: elasticsearch - name: ELASTICSEARCH_PORT value: "9200" - name: ELASTICSEARCH_USERNAME value: - name: ELASTICSEARCH_PASSWORD value: - name: ELASTIC_CLOUD_ID value: - name: ELASTIC_CLOUD_AUTH value: securityContext: runAsUser: 0 volumeMounts: - name: filebeat-config mountPath: /usr/share/filebeat/filebeat.yml readOnly: true subPath: filebeat.yml - name: filebeat-data mountPath: /usr/share/filebeat/data - name: varlibdockercontainers mountPath: /var/lib/docker/containers readOnly: true volumes: - name: filebeat-config configMap: defaultMode: 0600 name: filebeat-config - name: varlibdockercontainers hostPath: path: /var/lib/docker/containers - name: filebeat-data hostPath: path: /data/filebeat/data type: DirectoryOrCreateRun
kubectl apply -f filebeat-ds.ymlto deploy Filebeat Pod. -
Create a Kubernetes manifest file,
kibana.yaml:apiVersion: v1 kind: Service metadata: name: kibana labels: app: kibana spec: ports: - port: 5601 name: kibana selector: app: kibana --- apiVersion: apps/v1 kind: Deployment metadata: name: kibana labels: app: kibana spec: replicas: 1 selector: matchLabels: app: kibana template: metadata: labels: app: kibana spec: containers: - name: kibana image: docker.elastic.co/kibana/kibana:6.6.1 ports: - containerPort: 5601Run
kubectl apply -f kibana.ymlto deploy Kibana Pod.
Accessing Kibana UI#
The examples above don't expose Kibana UI port 5601 for security reasons. Below are examples of how to access the UI:
- expose the port using
kubectl port-forward $KIBANA_POD 5601:5601 - use SSH tunneling to get the port locally using
ssh -L 5601:localhost:5601 $USER@$REMOTE_HOST - visit
http://localhost:5601to access the Kibana UI